Why walkable urban areas are America’s efficient economic engines
Only 1.2% of land area in the 35 largest US cities are walkable land and generate 20% of GDP.
The Bragdon Committee: “In the late fifties, General J. S. Bragdon, working for the President, made some very serious charges against the Bureau of Public Roads’ (BPR) stewardship of the Interstate highway program and recommended far-reaching changes in the program. Among other things, he recommended an Interstate toll program, a cut-back in urban mileage, and a moratorium on all urban projects until a comprehensive planning process was established.”
Study: How Car Ownership is Keeping Americans From Financial Stability
The Social Cost of Automobility, Cycling and Walking in the European Union, Results suggest that each kilometer driven by car incurs an external cost of €0.11, while cycling and walking represent benefits of €0.18 and €0.37 per kilometer.
The average car costs a family about $9,282, is parked 95% of the time with ~85% of car costs leave the local economy. 2.24 cars per household (278.06 million cars, 124.01 million households)
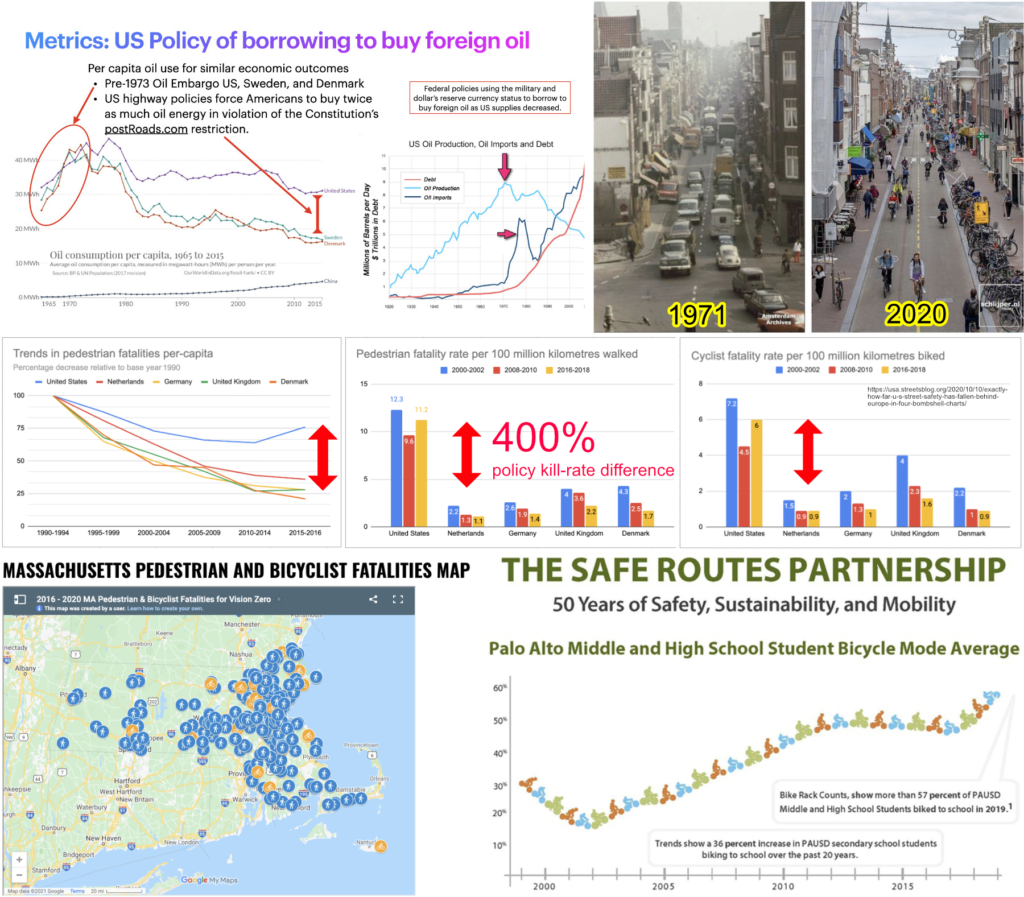
US government road policies kill bike riders and pedestrian at radically high rates.
Making cities safe to walk and bike in requires ending a century of unconstitutional government highway monopolies initiated by The Federal-Aid Highway Act of 1916. Review menus at www.postRoads.com. Link to the following grafts.
Prior to the 1973 Oil Embargo the US, Sweden and Denmark had the same:
- 43 megawatt-hour/person/year oil use.
- Safety record for pedestrian and bike road-kills.
Following the 1973 Oil Embargo road policies diverged:
- US policies continued sprawl.
- Sweden and Denmark changed highway-centric policies to focus on more walkable and bikeable streets. Per person oil consumption was cut to 60% below the US. Pedestrian and bike rider kill-rates were cut to 400% below US policies.

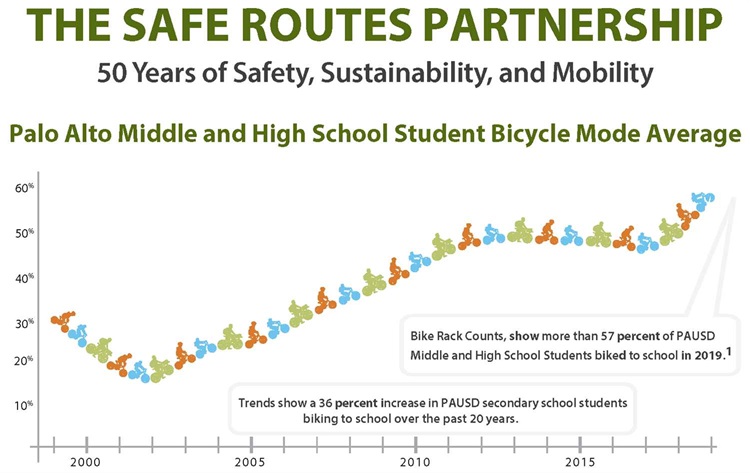
US road designs would make walking and biking to school safe. Palo Alto, CA provides a US example of following Sweden and Denmark’s policies:

Why 2023 was the year of the e-bike and not the self-driving car
https://www.startupselfie.net/2023/01/12/onomotion-ono-e-cargo-bike-last…
https://www.euronews.com/next/2022/09/17/the-worlds-cycling-nation-how-t…
data https://www.census.gov/hhes/commuting/files/2014/acs-32.pdf
cars https://www.rita.dot.gov/bts/sites/rita.dot.gov.bts/files/subject_areas/…
http://top10hell.com/top-10-countries-with-most-bicycles-per-capita/
http://www.reliance-foundry.com/blog/biking-usa-europe#gref
https://qz.com/160598/eleven-reasons-why-bicycling-in-the-us-is-exceptio…

https://www.treehugger.com/bikes/new-american-study-confirms-physically-…
The death and injury rate in the US is high compared to Europe, Controlling for exposure levels, cyclist fatalities in 2010 per 100 million kilometers cycled were 4.7 in the United States versus 1.0 in the Netherlands, 1.1 in Denmark, and 1.3 in Germany. Serious injury rates in 2010 were also much higher in the United States: 207 serious injuries per 100 million kilometers cycled versus 44 in Germany.
https://www.bostonglobe.com/metro/2018/05/16/bike-share-border-war-has-s…

Expanding bike cargo fleets, Frost and Sullivan webinar, 2024-03-26, RiderDome
Walkable Cities
- How Walkability Raises Home Values in U.S. Cities, Houses with the above average levels of walkability command a premium of about $4,000 to $34,000 over houses with just average levels of walkability in the typical metropolitan areas studied.
- Walkability and Its Relationships With Health, Sustainability, and Livability: Elements of Physical Environment and Evaluation Frameworks
- Walking is even associated with improved mental health.
- A study by Saint Maurice et al. (2020) on adults in the United States drew the correlation between higher daily step count and average all-causes mortality rates. The mortality rate for those above 65 years old who walked for 2,000 steps per day was found to be 78 per 1,000 as opposed to the mortality rate of 12 per 1,000 for those who walked 10,000 steps per day.
- The Economic Benefits of Walkable Communities
- Urban Land Institute of four new pedestrian-friendly communities determined that homebuyers were willing to pay a $20,000 premium for homes in them compared to similar houses in surrounding areas.
- Reducing traffic noise, traffic speeds, and vehicle-generated air pollution can increase property values. One study found that a 5 to 10 mph reduction in traffic speeds increased adjacent residential property values by roughly 20%. Another study found that traffic restraints that reduced volumes on residential streets by several hundred cars per day increased home values by an average of 18%.4.
- Hewlett Packard halted its planned expansion in Atlanta’s Perimeter Center area, according to the report, because it did not want to subject 1,000 new employees to the area’s serious traffic problems.
- The federal Office of Technology Assessment estimates that a single house built on the urban fringe requires $10,000 more in public services than one built in the urban core.
- The California State Department of Transportation, cited in another source, estimated in 1990 that more than 197,000 hours per day were being lost due to traffic congestion, costing California businesses more than $2 million a day. San Francisco’s Bay Area Economic Forum estimates that area businesses lose $2 billion per year while their employees sit in traffic.
- The American Highway Users Alliance estimates that commuters waste $1.1 billion a year idling in the Los Angeles region’s four most congested interchanges. Their cost estimates account for lost time, spent fuel, cost to employers, traffic accidents, and environmental damage.
- The Southern California region is expected to spend more than a trillion public and private dollars on roads and freeways, including more than $81 billion in public capital investment between 2000 and 2020. Yet, a report by the Southern California Association of Governments projects that those expenditures will result in a 330% increase in rush hour congestion because much of the new growth is expected to occur in outlying areas.
- Tourists coming to Vermont to walk and bicycle in the scenic, humanscale towns and compact, pedestrian-friendly town centers have proved to be an economic boon. In 1992, an estimated 32,500 visiting cyclists spent $13.1 million in Vermont – about twice the amount of money generated by Vermont’s maple syrup producers in a good year.
- Agriculture: California’s San Joaquin Valley – a primary source of fruits and vegetables for the entire nation – is a multi-billion-dollar industry. The region’s growers complain that vehicle-generated smog reduces crop yields by 20 to 25%.
- Sales Tax Revenue: Lodi, CA credits the pedestrian improvements, as well as economic development incentives, with the 60 new businesses, the drop in the vacancy rate from 18% to 6%, and the 30% increase in downtown sales tax revenues since work was completed in 1997.

