NYC
Problem:
Oil-dependent transport moves a ton to move a person in congested traffic.
Year after year without any innovation by the government, traffic costs the people of New York $48.9 billion each year.
- $25.2 billion per year on foreign oil
- $17.8 billion per year on accidents or about 11,200 injuries per million people per year.
- $5.9 billion per year on congestion
- More of what is failing will likely fail. Cuomo AirTrain to LaGuardia Airport called $1.5B “boondoggle” by critics. JPods can build this at no taxpayer expense in 18 months with far better service.
Solution:
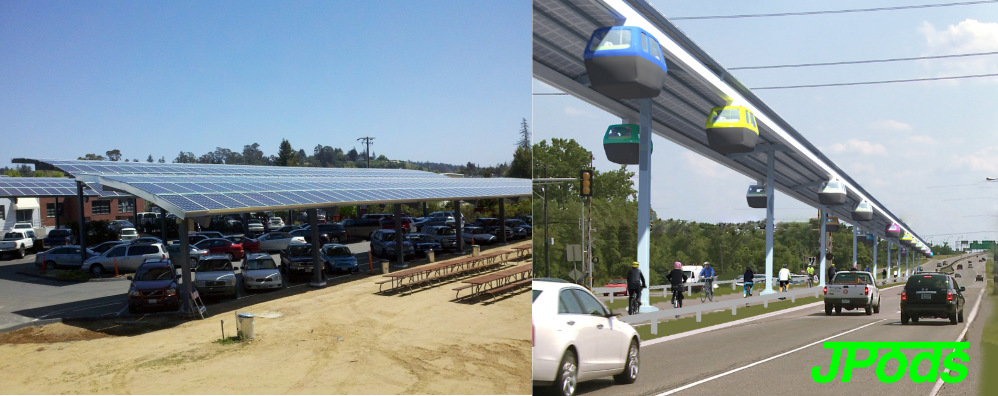
Recover $9 billion per year by moving only the person and freight above the roads. Solar-powered transportation is safer, faster, cleaner and affordable. On-demand mobility regardless of age, ability or wealth. Life requires energy. Energy self-reliance. Links to
- summary, Print Quality or Email Quality.
- Plan for LaGuardia Airport
- LaGuardia Talking Points and Travel Times to NYC Airports
- One Page LaGuardia
- Proforma
- Costs per Trip NYC
Two ways to fund building the networks:
- Tax the people of NYC $1.5 billion to build a light rail between LaGuardia and the trains
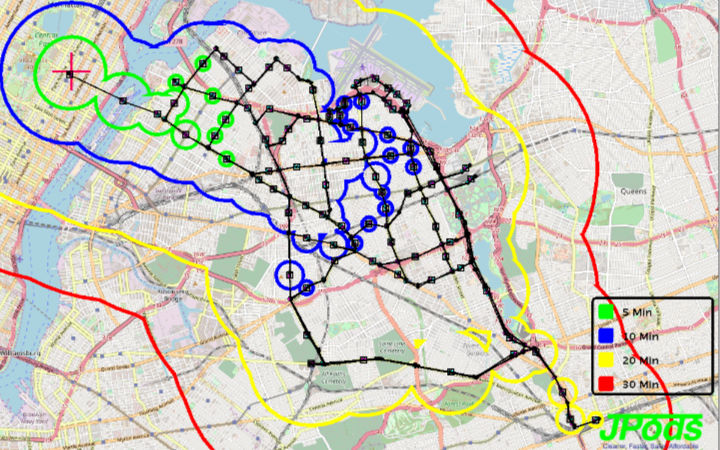
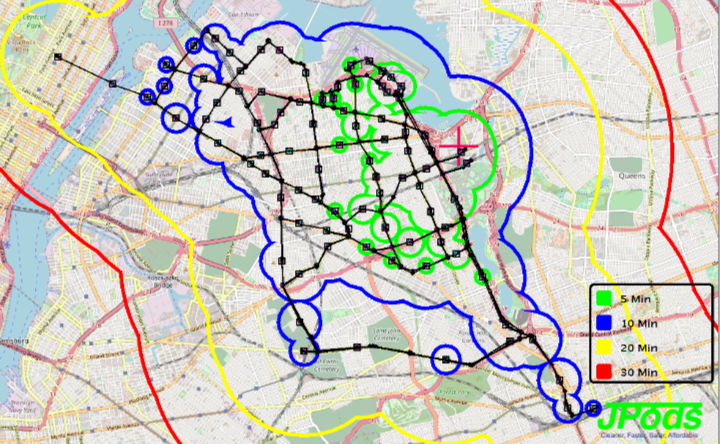
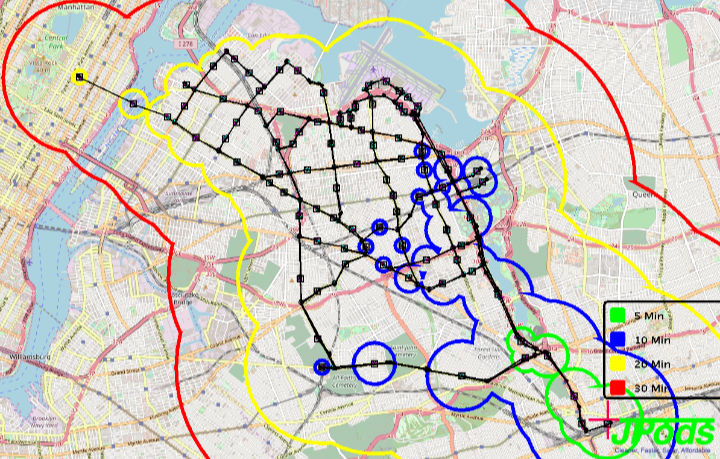
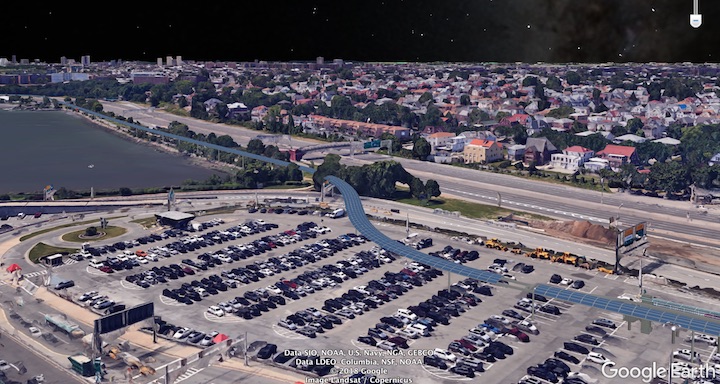
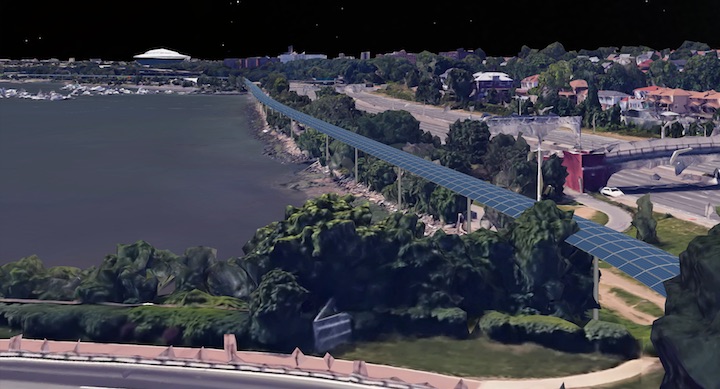
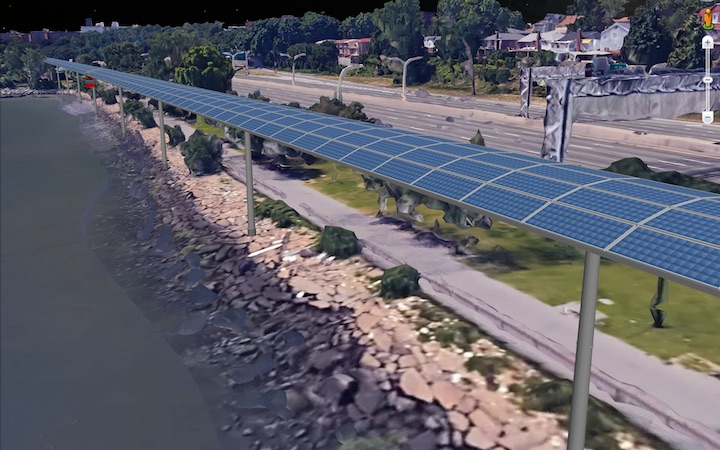
- No cost to the taxpayers. Allow JPods to privately fund building a $1.5 billion network illustrated in the following Route-Time™ maps.
Travel Times and Jobs
This is a rough approximation of an example networks of about $1.5 billion in cost. Those wishing to refine the network may download JPods software and build alternatives that are more precise. JPods is look for people to be part of our team that builds these networks. Unlike the light rail proposed by Governor Cuomo, there will be an opportunity for local manufacturing jobs in making the components for JPods networks. Using FTA estimates, about 19,500 job-years would be created building this network in NYC.
Because JPods networks carry people and cargo, many local distribution jobs for freight that do not exist today are likely to be created.
Starting with the Red Cross in Manhattan, where you can walk, ride, walk is Green = 5 mins, Blue = 10 mins, Yellow = 20 min.
Starting with the Red Cross at LaGuardia, where you can walk, ride, walk is Green = 5 mins, Blue = 10 mins, Yellow = 20 min.
Starting with the Red Cross at Jamaica Station, where you can walk, ride, walk is Green = 5 mins, Blue = 10 mins, Yellow = 20 min.

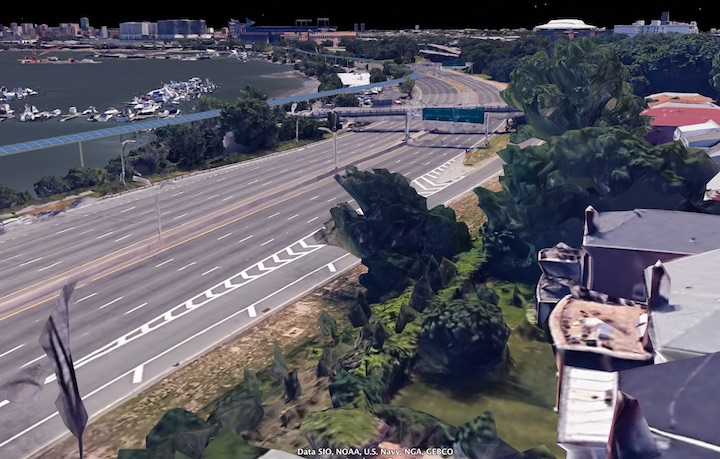
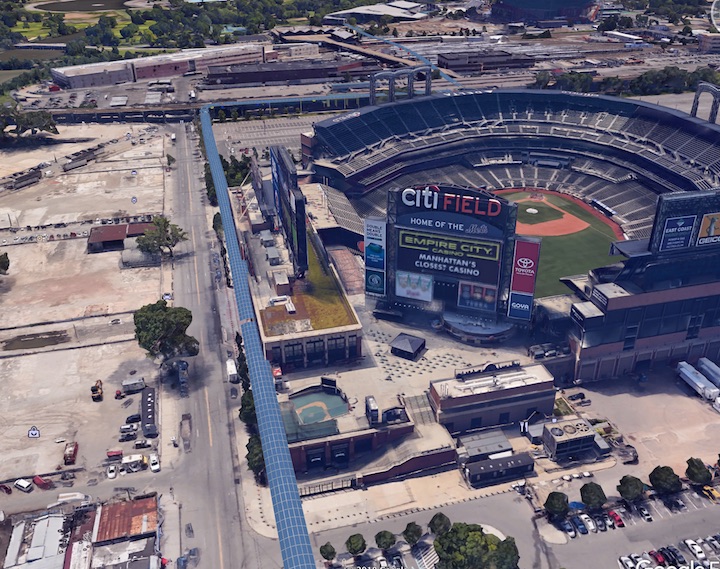
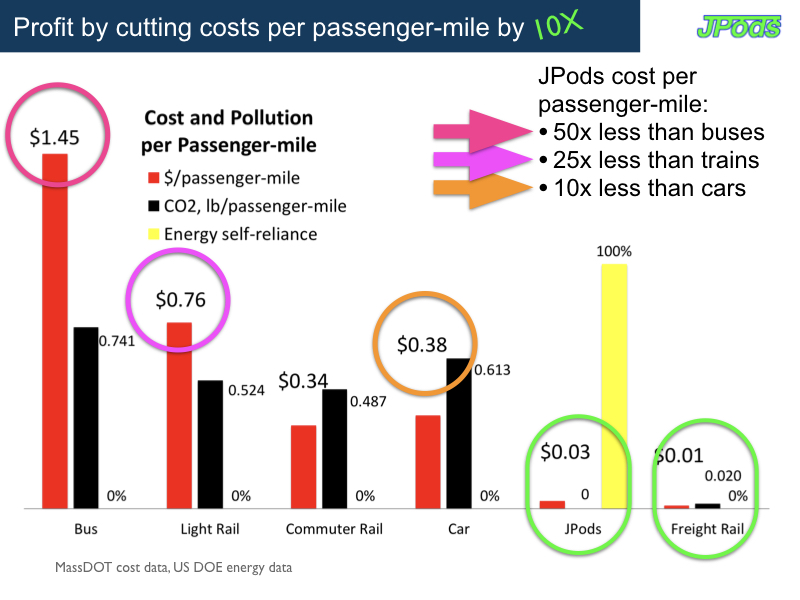
Why Private Capital will Invest
Networks are privately funded based on their capacity to convert 90% of current urban mobility costs into value.
Summary Video:
Execution:
- Physics: It costs less to move less.
- Concept: Computer controlled, ultra-light JPods rail networks move people and cargo on-demand; a Physical-Internet; a circulatory system for an economic community.
- Legal: Pass the Performance Standard Law of Massachusetts Senate Bill #1837. Build with private capital and exceed 5-times the energy efficiency of highways.
- Market Niche: On-demand mobility for highly repetitive, commuter-range transport of cargo and people.
- Safety: > 2,000 times safer than cars.
- Emissions: Zero.
- Congestion: Zero.
- Efficiency: 200 watt-hour per mile. Mobility savings are amplified by the 6x Net Energy of solar over oil.
- Power: Solar collectors gather 25,000 vehicle-miles of power per mile of rail per day. Distributed transportation grid harvests distributed natural power.
Capacity:
| Relative Seat Capacity per Hour (not all seats are filled): | |||
| Seats per Vehicle | Headway | Seats per Hour | |
| Bus | 0-50, 50 used | 5 mins | 600 |
| Light Rail | 0-200, 200 used | 10 mins | 1200 |
| Automobiles | 1-6, 4 used | 1-6 secs | 4800 |
| JPods | 1-6, 4 used | 3 secs | 4800 |
| JPods | 1-6, 4 used | 1 secs | 14400 |
| JPods | 1-6, 4 used | .5 secs | 28800 |
| JPods | 1-6, 4 used | .25 secs | 57600 |
| .25 second headway gives each vehicle 3.91 meters of space. | |||
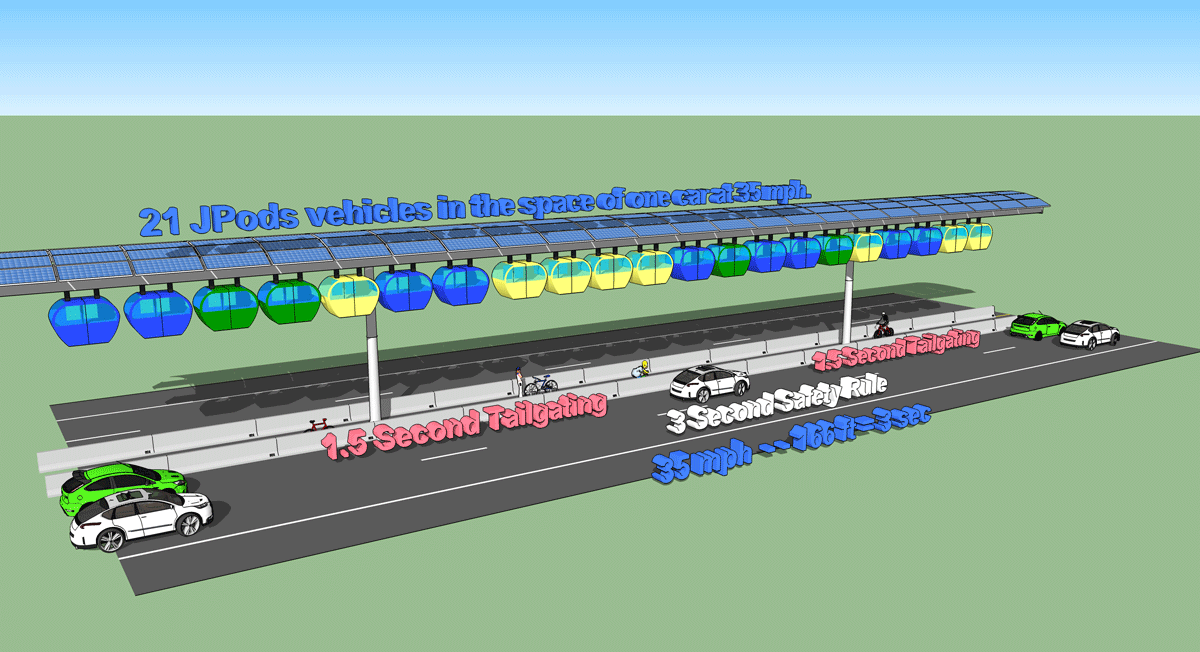
Energy Self-reliant with Zero Carbon Emissions
Solar collectors over JPods networks gather about 4 megawatt-hours per mile per day. This is enough to power 40,000 vehicles to travel each mile each day.
The 70-mile networks shown in the Route-Time™ maps above will gather about 280 megawatt-hours per day.
Station Configuation
Many small stations distributed at the Airport, hotels, car parking, etc… support networking the LaGuardia economic community.


Safety
Who dies in a car accident is random. That 40,000 Americas will be killed on roads this year is a design feature of the technology,
Thrill rides at NY theme parks are regulated by the ASTM F24 standards with 0.2 injuries per million. In contracts DOT roads have about 11,200 injuries per year. Radically safer standards are well understood and implemented in the State of New York.
JPods Contract in Shaxian China
Rule of Law
The current state power and transportation monopolies directly violate the US and NY Constitutions. As with the near century of rotary telephones under government monopolies, the transportation binds the survival of the people of NY to the efficiency of the Model-T (25 mpg). These government monopolies are the cause of oil-dollar funded terrorist attack on the New York City, oil-wars since 1991, Climate Change, and other defects;
- New York Constitution, Article 1, Bill of Rights allows the building of solar-powered mobility networks. “7(c) Private roads may be opened in the manner to be prescribed by law; but in every case the necessity of the road and the amount of all damage to be sustained by the opening thereof shall be first determined by a jury of freeholders, and such amount, together with the expenses of the proceedings, shall be paid by the person to be benefitted.”
- To prevent a Federal repeat of the defects of the King’s transportation monopoly (Boston Tea Party), the US Constitution forbids the Federal governing to tax to build roads beyond what is essential to deliver letters in defense of free speech, restrictions in the Premable, “post Roads”, “Ports”, Amendments 9 and 10. Climate Change and perpetual oil-wars illustrate the importance of enforcing the Rule of Law.
The 5X5% Performance Standard allows networks 5 times more efficient than government monopolies to use the public Rights of Way for 5% of gross revenues:
//////////////// BEGIN Solar Mobility Act ////////////////////
THEREFORE, BE IT RESOLVED,
Non-exclusive access to rights-of-way governed by this jurisdiction will be granted to transportation systems providers meeting the following free market principles:
(1) Privately funded construction to preempt pork projects, and
(2) Privately operated without government subsidies to preempt corruption, and
(3) Exceed 5 times the efficiency of roads, or more than 120 passenger-miles per gallon, and
(4) Exceed 5 times fewer injuries/milllion people than roads, and
(5) Gather at least 50% of power requirements from renewable sources for above ground networks.
THEREFORE, BE IT FURTHER RESOLVED, Regulation of free-market innovations shall be based on:
(1) System design, fabrication, installation, safety, insurance, inspection practices shall be compliant with the ASTM International, Committee F24 on Amusement Rides and Devices (0.2 injuries/million versus 11,200/million road users), and
(2) Environmental approvals are granted based exceeding existing efficiencies by 5 times (networks may be rejected in timely, written reports for other considerations), and
(3) All taxes and fees assessed on the systems providers, passengers and cargo shall be limited to 5% of gross revenues from transport and paid to the aggregate rights-of-way holders by the systems providers.
(4) Specific networks franchises will be governed similar to how communications networks are governed.
////////////////// END /////////////
Capital Investment
Approximately $28 billion was invested in mobility startups in 2017, mostly in Ride Services. These Ride Service have improved customer service by providing better service than the subways and buses but increased NYC congestion by 3-4%.
Studies
West Point System Engineering text: Decision Making in Systems Engineering and Management
by, Gregory S. Parnell, Ph.D., Editor
by, Patrick J. Driscoll, Ph.D., Editor
by, Dale L. Henderson, Ph.D., Design Editor
In fact, one of the most significant failings of the current U.S. transportation system is that the automobile was never thought of as being part of a system until recently. It was developed and introduced during a period that saw the automobile as a standalone technology largely replacing the horse and carriage. So long as it outperformed the previous equine technology, it was considered a success. This success is not nearly so apparent if the automobile is examined from a systems thinking perspective. In that guise, it has managed to fail miserably across a host of dimensions. Many of these can be observed in any major US city today: oversized cars and trucks negotiating tight roads and streets, bridges and tunnels incapable of handling daily traffic density, insufficient parking, poor air quality induced in areas where regional air circulation geography restricts free flow of wind, a distribution of the working population to suburban locations necessitating automobile transportation, and so on. Had the automobile been developed as a multilateral system interconnected with urban (and rural) transportation networks and environmental systems, U.S. cities would be in a much different situation than they find themselves in today.
What is important here is not that the automobile could have been developed differently, but that in choosing to design, develop and deploy the automobile as a stand alone technology, a host of complementary transportation solutions to replace the horse and buggy were not considered.
Design the System for the desired characteristics:
| Government Studies | ||
| Video of Cabinetaxi | This hundred million dollar test system failed to be expanded on as the 1973 Oil Embargo faded and the will to expand sustainable infrastructure evaporated. The technology worked before modern computer networks. JPods patented the application of distribute collaborative networks and reduced the large parasitic mass of this types of personal automated mobility. | |
| Last Oil Crisis, 1975 | At Senatorial request, DOT defined PRT as a likely solution to oil addiction. It also noted the likely reasons it would not be adopted which had to do with lack of will to implement simple solutions. | |
| March 2007 GAO Report |
We are in the midst of Peak Oil or will experience the consequences before we can re-tool transportation. U.S. consumers paid $38 billion more for gasoline in the first six months of 2006 than they paid in the same period of 2005, and $57 billion more than they paid in the same period of 2004…. |
|
| May 2007 New Jersey Study | Study commissioned by New Jersey’s Legislature. It was performed by Booz, Allen, Hamilton | |
| 060322_EUStudy.pdf | Definitive study by the European Union. PRT contributes significantly to transport policy and all related policy objectives. This innovative transport concept allows affordable mobility for all groups in society and represents opportunities for achieving equity. The demonstration of the PRT prototype system ?ULTRA? at a test site in Cardiff, four accompanying case studies at different cities and the overall European assessment indicated high overall benefits. The specific urban transport problems in particular of new member states, accession and candidate countries could be alleviated significantly at a lower cost than any other transport system. PRT is the personalization of public transport, the first public transport system which can really attract car users and which can cover its operating cost and even capital cost at a wider market penetration. PRT complements existing public transport networks. PRT is characterized through attractive transport services and high safety. | |
| Corps of Engineer Study | Corps of Engineer’s Study on the need to migrate to alternative energy sources. | |
| InnovPTS2_Swedish.pdf | Swedish study of PRT and its importance to replace auto trips. | |
| CSTWinnipegGilbert_0604.pdf | Canadian Sustainable Infrastructure study of energy sources and PRT. | |
| edict_brochure.pdf | European Union Summary of Study for PRT in several cities. | |
| directory_fp5_cot_projects_en.pdf | European Union extensive scientific approach to designing cities of the future. | |
| Implementations | ||
| Morgantown_TRB_111504.pdf | Morgantown, WV has been operating an oversized, hybrid of Group and Personal Rapid Transit since 1975. They logged 100 million injury free passenger miles. | |
| hagenstudyCabinetTaxi.pdf | German PRT project | |
| Wupertal | Because of its suspended design, the Schwebenbahn is one of the safest transportation systems in the world. Having carried more than 1.5 billion passengers it has had only one fatal accident at the cost of 5 lives. That is radically different than the 40,000 deaths per year from cars in the US. | |
| Industry and Academic Studies | ||
| prt_Campus_Schneider.pdf | Study of campus solution with PRT. | |
| EPA sponsored Studies | Study of specific implementations by Steve Raney. Very well defined method of determining benefits | |
| SolarEvolution | Solar energy company presentation on the synergy between low mass transit and solar energy. | |
| Excellent study of how a network the size of New Jersey can be broken into implementations by economic community. | ||
| prt_Campus_Schneider.pdf | Study of campus solution with PRT. | |
| Prt_Italian.pdf | Italian PRT study. | |
| PRTinitiative_TRB_4web.pdf | PRT study presented at the TRB. | |
| FutureofHCPRT-Jan606.doc | Dr. Ed Anderson’s 2005 paper on PRT. Ed is a leading pioneer and carried the torch for many years. | |
| infrastructure_cost_ASCE.doc | Cost comparison of various infrastructure alternatives. | |
| LeanManufacturingTransit.pdf | Just-in-Time productivity gains benefited manufacturers’ shift from Mass Production. The same focus on quality applies to productivity opportunities in Mass Transportation. | |
| T2K-Rebuttal-to-CALS.pdf | Taxi 2000 response to not being selected as the vendor for Cincinnati’s people mover. | |
| Ultra_case_studies.pdf | Ultra’s case studies of various PRT opportunities | |
| Ultra_clean_air_paper.pdf | Ultra’s clean air study. | |
| Ultra_Econ_assessments.doc | Ultra’s Economic Assessment | |
| CascadiaHitchhikePaper.doc | PRT study of the Microsoft Campus area. | |
| CaseForPRT.pdf | Study on why PRT is important. | |
| CostPerMileOperations_UWa.pdf | Study of Cost per Mile of various rail systems. | |
| emery_genl_plan.ppt | Powerpoint using Emeryville, CA as an example of the benefits of PRT. Presentation by Steve Raney of Cities21.org. | |

