Metrics
Summary:
- Watt-hours/passenger-mile: bikes 15, JPods 78, walking 116, motorcycles 545, commuter rail 881, cars 1,032, buses 1,245, and taxis 4,204.
- Watt-hours/passenger-km, bikes 10, JPods 47, walking 73, motorcycles 339, commuter rail 548, cars 641, buses 774, and taxis 2,613.
- Safety: Podcar networks comply with standards requiring less than 3.7 injuries per million. DOT rate is 11,200 serious injuries per million. The Morgantown PRT has zero service caused injuries in 53 years. In that period 1.8 million Americans have been killed on roads.
- NASA: “Road Transportation Emerges as Key Driver of Warming”
- Federal funding 90% of highway costs violates the US Constitution as explained in 21 Presidential veto messages. The Boston Tea Party was a demonstration against the general government’s mercantile transport monopoly. Federal highway monopolies rebuilt that path to war.
- Oil-wars since 1990 result from oil accition caused by the federal mercantile highway monopoly and failing to answer 10 Presidents calls to action to end foreign oil addiction.
- US cities have 5 times more miles of roads than they can afford to maintain.
- Highway linear barriers to commerce has so sliced up US cities that only 1.2% of urban land is walkable, produce 20% of US GDP, and are net positive revenue to cities.
Cost of Traffic
Yet Americans spend $2.76 trillion/year to sit in traffic jams and wait for mass transit. 69% ($1.91 trillion/year) are urban costs.- $756 billion per year for oil.
- $871 billion per year in accidents, alternate data source.
- 40,100 road-deaths in 2017.
- 2.31 million injuries in 2013.
- $305 billion per year in congestion.
- $109 billion per year in car damage from poor road maintenance.
- $723 billion per year in land use at $1 per square foot per year (cost of a garden plot, apartments are normally $2-5 square foot per month with multiple floors in a single square foot of land).
188 times greater efficiency is well understood, 95% of traffic costs are waste
Warren Buffett, “It {railroads} moves a ton of goods 470 miles on one gallon of fuel.” This is 188 times more efficient than moving a 200 pound person at 25 mpg. Yet Federal highway policies have replaced 45% of freight railroads with roads. 470 ton-mpg equal 181 metric tons per liter.
Commerce and Community are Pedestrian
60% of the solution rising gas prices is walking and biking. Link to walkability score. In 1902, before government transport monopolies, every city in the US over 10,000 people had a privately funded street car system (wikiPedia list). Cities were walkable. Commerce and Community are both pedestrian activities:- World Economic Forum: Only 1.2% of land area in the 35 largest US cities are walkable land and generate 20% of GDP.
- CNBC: How Suburban Sprawl Weighs On The U.S. Economy
- How Suburban Development Makes American Cities Poorer [ST02]
- Why American Cities Are Broke – The Growth Ponzi Scheme [ST03]
- How public spaces make cities work, Amanda Burden, TED

Known Solution to Efficiency and Safety
Through grade-control or grade-separation (think freeways) tadically more efficient and safer transport networks are well understood:-
188 times greater transport efficiency has been know for 2 centuries. The 140,000 miles of freight railroads in the US average 470 ton-mpg. This is 188 times more efficient than moving a 200 pound person with the 25 mpg efficiency of the Model-T. This efficiency is achieved by grade-control to remove repetitive applications of power in start-stop traffic. https://jpods.com/conservation/
-
3,000 times better safety has been well understood for a half century+. Grade-separated theme park thrill rides have 3.7 injuries per million versus 11,200 serious injuries per million on roads. https://jpods.com/safer/
Walking a mile requires about 100 calories or 116 watt-hours. Calculations of fuel efficiencies. Summary:
Source on cost per passenger-mile. Cars are $0.592 per vehicle-mile according to AAA is adjusted by the 1.57 passengers/car reported by DOE. The 1.57 Load is also applied to JPods costs of $0.04 per vehicle-mile.
Example Ton-mile per gallon calculations (link):
- Watt-hours/passenger-mile: bikes 15, JPods 78, walking 116, motorcycles 545, commuter rail 881, cars 1,032, buses 1,245, and taxis 4,204.
- Watt-hours/passenger-km: bikes 10, JPods 47, walking 73, motorcycles 339, commuter rail 548, cars 641, buses 774, and taxis 2,613.
| Mode | Passengers-vehicle | BTU’s | passenger-mile | passenger-km | FTE |
| Watt-hours | Watt-hours | ||||
| Freight Railroads | 22 | 6 | 4 | 1 | |
| JPods | 1.57 | 260 | 78 | 47 | 13 |
| Performance Standard | 1.57 | 954 | 280 | 174 | 47 |
| Van pool | 6.1 | 1322 | 389 | 242 | 65 |
| Motorcycles | 1.2 | 1855 | 545 | 339 | 91 |
| Rail, Amtrak | 20.5 | 2650 | 779 | 484 | 130 |
| Rail, Transit (light & heavy) | 22.5 | 2784 | 818 | 508 | 136 |
| Rail, Commuter | 31.3 | 2996 | 881 | 548 | 147 |
| Air, domestic | 96.2 | 3261 | 959 | 596 | 160 |
| Cars | 1.57 | 3512 | 1032 | 641 | 172 |
| Personal trucks | 1.72 | 3944 | 1159 | 720 | 193 |
| Bus, Transit | 8.8 | 4235 | 1245 | 774 | 208 |
| Taxi, demand response | 1 | 14301 | 4204 | 2613 | 701 |
10X is required to drive a paradigm shift
| Cost | Typical | JPods | Times Better | Background | |
| Capital cost of light rail | $202 million/mile | $20 million/mile | 10X | $million per mile to build (light rail verses JPods) | |
| Capital costs of newcar ownership. | $10,728 | 0 | 10X | JPods provide Mobility As a Service. | |
| Cents per vehicle mile traveled. | 63.74¢ | .04¢ | 10X | Graph above is per passenger-mile using government estimation of 1.57 people per car. | |
| Traffic accident costsper American per year | $1,035 | $0.00 | 10X | Morgantown’s PRT has had 5 minor injuries in 50 years. Roads have 4.5 million injuries per year. | |
| Road injuries permillion people per year | 11,200 | 0.9 to 3.4 | 10X | Injuries per million using US DOT regulations versus ASTM F24 regulations. | |
| Human Factors | |||||
| Access | Afford cars | 8 ys and older | 6X | % that cannot drive/operate, under 5 years old | |
| Congestion | 48 | 5 | 10X | Hours lost to congestion each year | |
| Capacity, Cars | 4800 | 28,000 | 6X | *4 seats every 3 seconds for cars and .5 seconds for JPods | |
| Capacity, Bus | 600 | 28,000 | 10X | *Busfive minutes apart with 50 seats verses JPods | |
| Capacity, Trains | 1200 | 28,000 | 10X | *Trains 10 min apart with 200 seats verses JPods | |
| *JPods can have multiple rails is same right of way | |||||
| Environmental | |||||
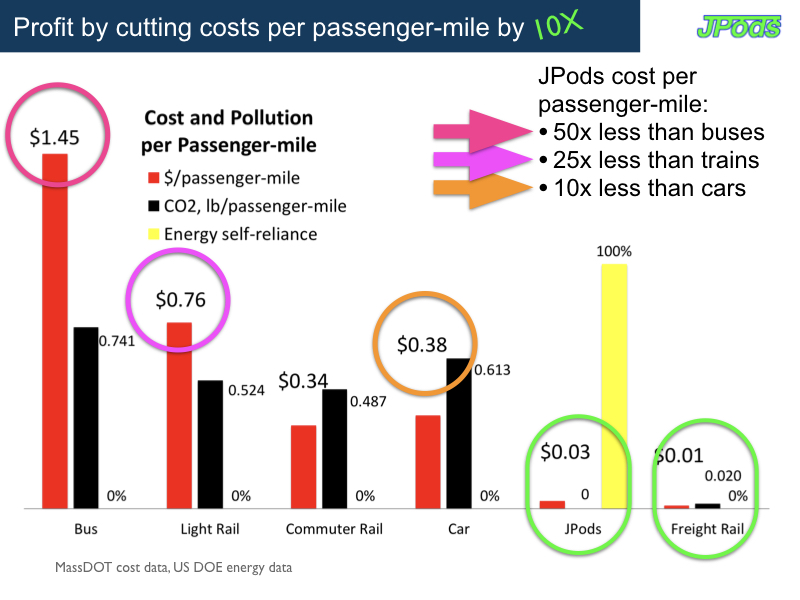
| Pollution per passenger-mile | ~.5 pound | 0 | 10X | See graph above converted from energy required per passenger-mile. | |
| Land Use | 2,642 | 29 | 10X | Square feet per vehicle | |
| Security | |||||
| Defense | 492 billion | Self-reliance | 10X | 1% the estimated cost of Iraq War | |
| Trade Deficit | 584 billion | Self-reliance | 10X | 2006 Trade Deficit for cars and oil | |
| Currency Value | Cause | Self-reliance | 10X | Foreign oil addiction weakens the dollar | |
| Peak Oil | Cause | Self-reliance | 10X | US Peak Oil was in 1970 | |
| Climate Change | Cause | Self-reliance | 10X | Mobility within a solar budget | |
Family Car Costs
Each car:- Costs American families between $5,262 and $10,728 per year.
- Are parked 95% of the time.
- Consume 16% of our income ($813/monrh).
-
The average car costs $9,282/year, is parked 95% of the time, with 85% of car costs draining out of the local economy. Oil imports are 6.7 mb/d of foreign oil at $87, a yearly drain of $213 billion.
Ride-hail:
- Even in the cheapest areas, fares now cost $2 per mile or more. In El Paso, Texas trips averaged $2.10 per mile in 2023 dollars, making it the most affordable U.S. city for Uber passengers, according to research by Netcredit. Detroit took a close second at $2.11.
- However, fares ran higher in larger urban centers, especially northern ones. Riders paid $2.56 per mile in 2023 dollars in Los Angeles, $4.32 in New York City, and $3.25 in San Francisco.
Injury Rates per Million
Injury rates per million people (details):- 11,200 serious injuries per million people on roads using DOT standards.
- 3.7 injuries per million on theme park thrill rides using ASTM International F24 standards.
- Morgantown PRT has had 5 minor injuries since President Nixon sent his daughter Tricia to open this first grade-separated network of self-driving cars in 1972.
- Wuppertal suspended train (grade-separated) had one fatal incident since it opened in 1901.
Life Requires Energy, Disposable Energy
Disposable Energy measures how much energy people can buy with their take-home-pay. How much energy can people afford to pursuit happiness. How much energy can labor buy to apply to building economic momentum.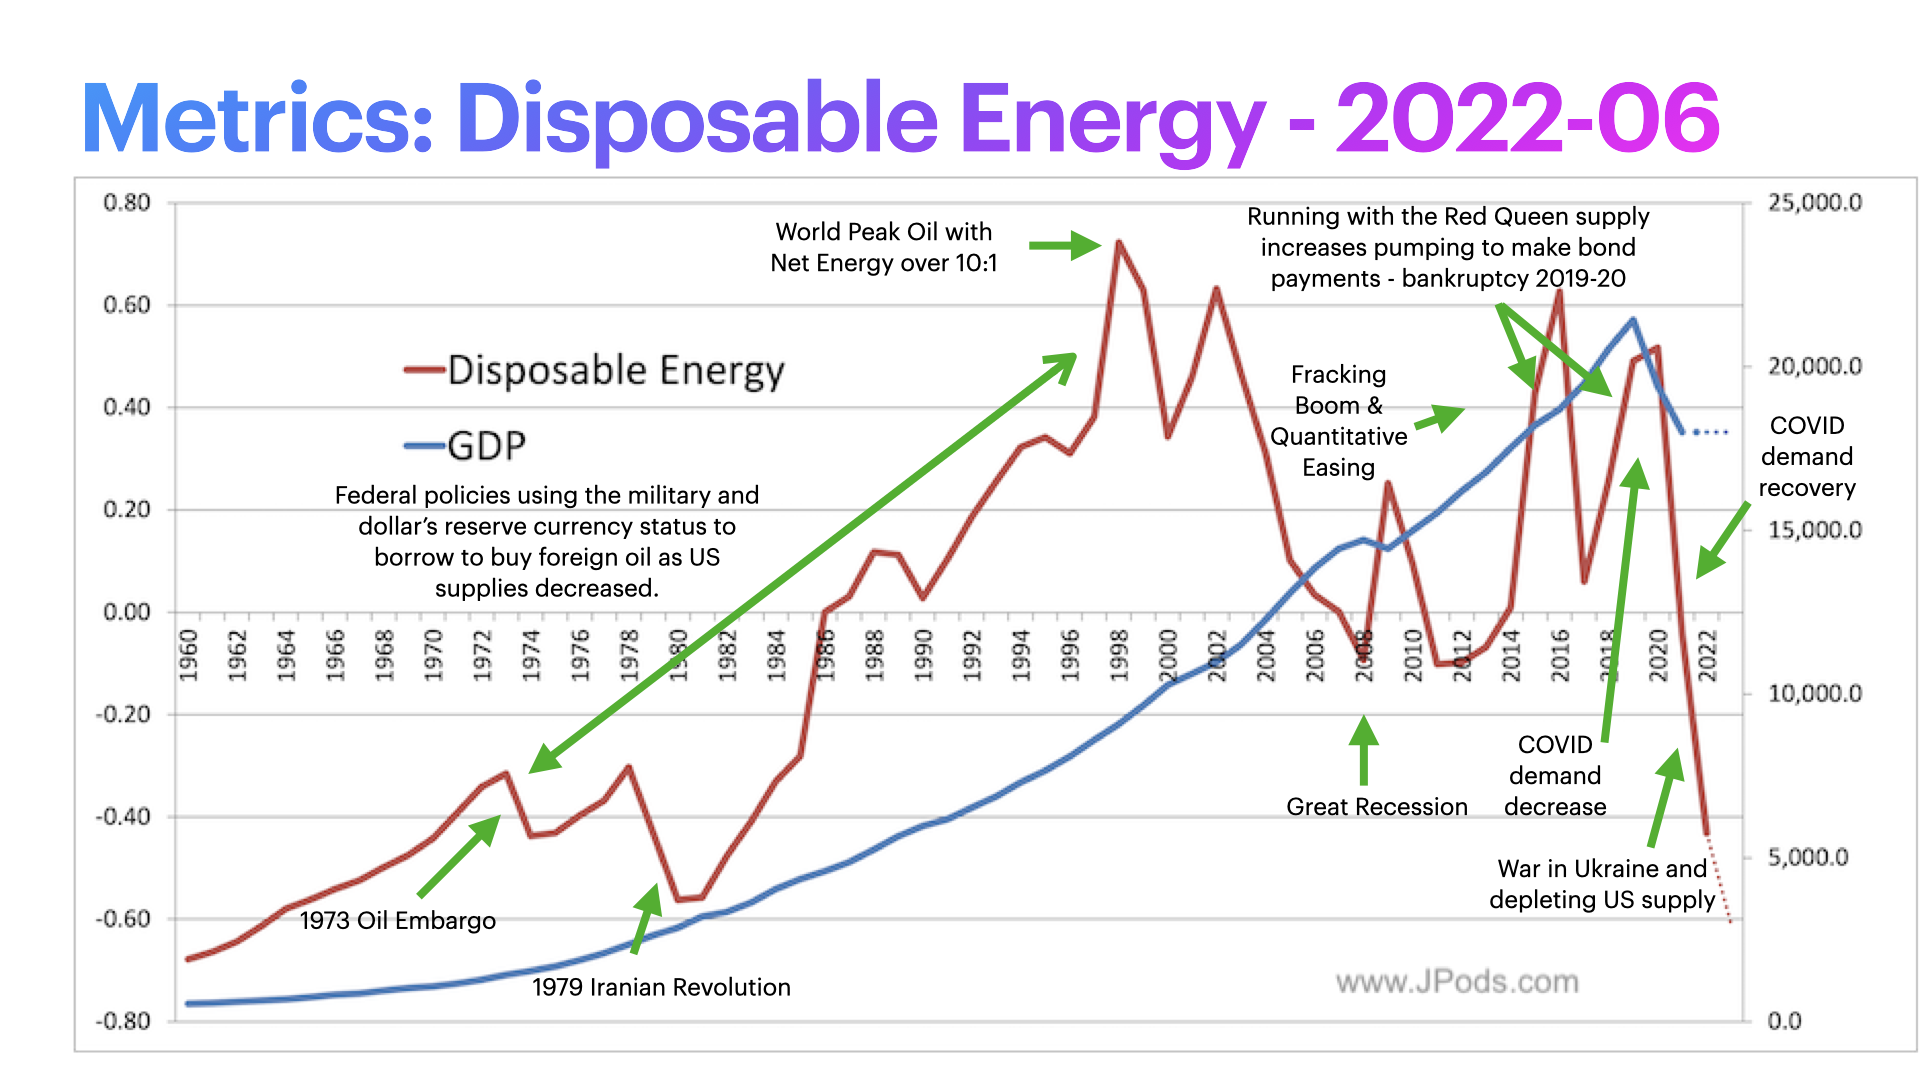
Parasitic Energy Ratio (PER)
This is a simplified way to measure relative waste of various modes of transportation. PER = Stop-Starts on a trip x Vehicle Mass per passenger / Payload Mass (mass of a person)- Gross Mass is the 4,000 pound car or 6,000 pounds of train/bus per passenger plus the 200 pounds of the passenger.
- Payload Mass is the 200 pounds of the person.
- 10 or some number of stations or stop light experienced on a trip.
 Steps to put this metric in personal terms:
- Park your car in your driveway empty of gasoline.
- Put in one gallon into your tank.
- Get 5 of your strongest friends (watt-hours per persons).
- Drive until you run out of gas.
- Push your car home. It will take you between 3 (very hard working friends) to 7 (normal person) days working 8 hours a day.
Parasitic Energy Ratio (PER) Calculations (with stops for traffic/stations between origin and destination)
| Mode | Start-Stops | Vehicle Mass per Passenger (kg) | PER Calculation | PER Value | Wh/passenger-mile |
|---|---|---|---|---|---|
| Car | 10 | 1,300 | (10×1300)/90 | 144.4 | 1032 |
| Bus | 10 | 1,167 | (10×1167)/90 | 129.7 | 1245 |
| Light Rail | 10 | 1,633 | (10×1633)/90 | 181.4 | 818 |
| Bike | 5 | 20 | (5×20)/90 | 1.1 | 25 |
| JPods | 1 | 250 | (1×250)/90 | 2.8 | 78 |
Economic Work as measured by Costs per Passenger-mile
The following graph uses MassDOT data to compare cost per passenger-mile and pollution per passenger-mile for various modes of transportation. Cost per trip, 2024. Solar-powered mobility networks have no operational pollution and much lower cost of operation.- Mass transit buses produce more pollution per passenger-mile than cars.
- Mass transit trains are nearly as polluting as cars.
Trip distance
DOE link
Net Energy
Economically useful energy per unit of energy required to obtain that energy. Oil used to be 100:1 but has depleted to 3:1. Solar is 25:1 for wind and 20:1 for photovoltaics. Very good 18 minute summary of Energy Economics. Candidates and policies that support improved Net Energy will create jobs from surplus energy.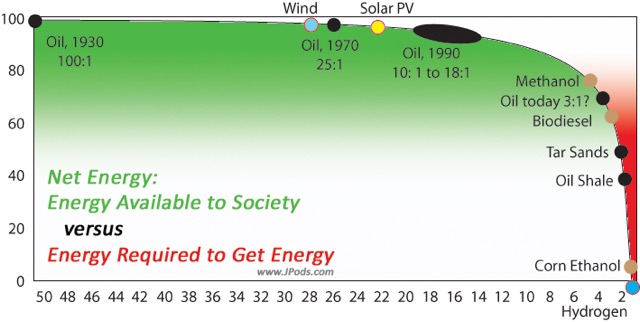
Energy Security
Life requires energy. Risks to energy supplies are currently not measured. A metric is needed for Thomas Edison was correct when he observed in 1910 that:“Sunshine is spread out thin and so is electricity. Perhaps they are the same, Sunshine is a form of energy, and the winds and the tides are manifestations of energy.” “Do we use them? Oh, no! We burn up wood and coal, as renters burn up the front fence for fuel. We live like squatters, not as if we owned the property. “There must surely come a time when heat and power will be stored in unlimited quantities in every community, all gathered by natural forces. Electricity ought to be as cheap as oxygen….”
Quality of Service
Food Metrics
A typical person needs about 2,000 food calories, or 2,000 kcal per day with little physical activity. This equates to 2.33 kWh or 1 megawatt-hour per year. People who are physically active it may be significantly higher (30 – 150% more).Energy Consumption
The typical American uses 88.5 megaWatt-Hours of energy per year. Cutting all energy use 45% would put the average American at 48.7 megaWatt-Hours, or roughly the same as the 47.2 megaWatt-Hours used by the average German.Economic Work
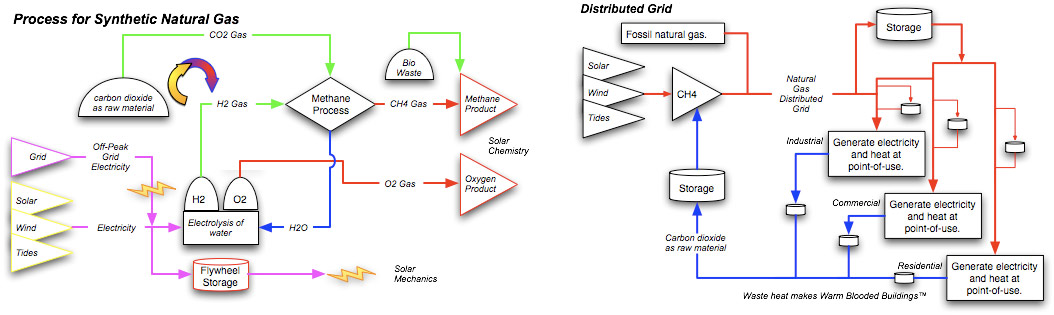
energy and transportation should thought of aspects of creating and delivering economic value. The physics definition of work is force applied to mass. The economy is a momentum artifact, a flywheel of labor applying energy to produce, store and distribute energy. Life requires energy. If I had a choice, money would be back by energy, not debt or gold.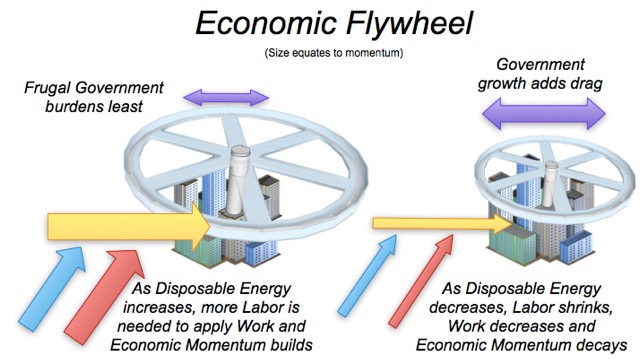 Ref: “Is the technology off the shelf ready?”
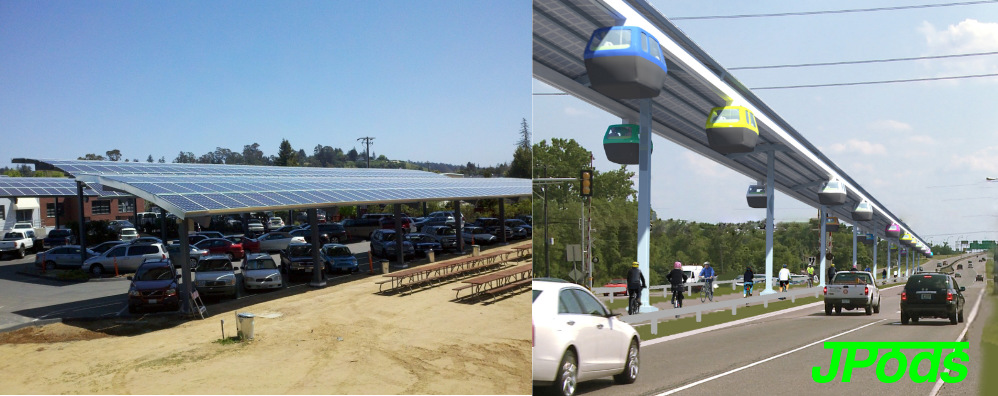
The technology to power our lives within a solar budget are mundane. If you can ride vertically in an elevator, why should you not be able to go horizontally by similar mechanism? JPods are incredibly simple mechanics and clever software programming. You can see similar technologies:
Ref: “Is the technology off the shelf ready?”
The technology to power our lives within a solar budget are mundane. If you can ride vertically in an elevator, why should you not be able to go horizontally by similar mechanism? JPods are incredibly simple mechanics and clever software programming. You can see similar technologies:
- At Kiva Systems ($33 million investment from Bain Capital in mid-2000s and sold themselves to
- The Personal Rapid Transit (PRT) network built in Morgantown, WV as a solution to the 1973 Oil Embargo has delivered 110 million oil-free, injury-free passenger-miles (link to video, Congressional Office of Technology Assessment study PB-244854, audit and letter from the Mayor of Morgantown).
- Hyperloop and ET3. Why are governments funding magnetic levitation of a thousand-ton train when a 400 pound pod can be deviated in a vacuum tube and travel using 1/50th the energy.
- Disposable Energy
- Net Energy
- CO2 per Passenger-mile (per unit of Economic Work)
- Economic Work, Cost per Passenger-mile (per unit of Economic Work)
- Parasitic Energy Ratio
Real Estate Consumption versus Green Space Recovery
Link at YouTube
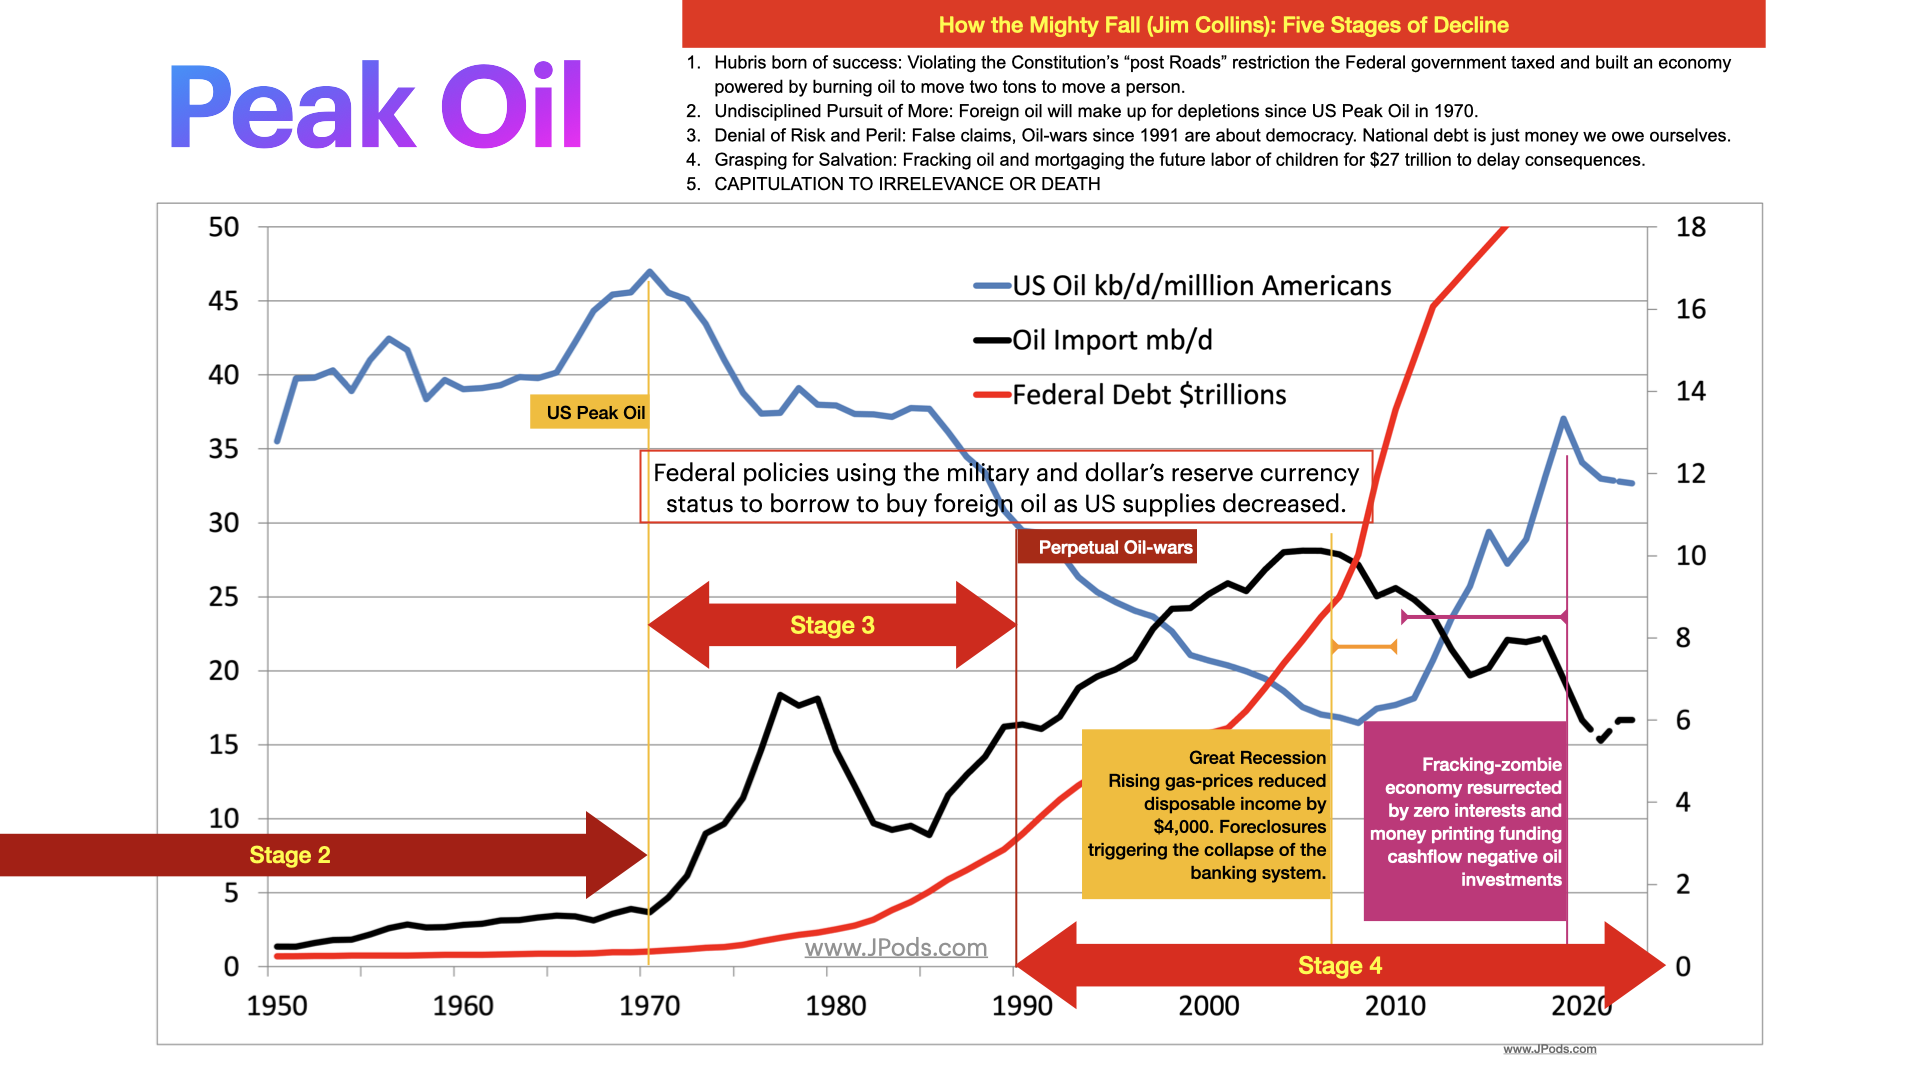 The Law of Supply and Demand has been clear since US Peak Oil in 1970. As US oil fields depleted gas prices ratched higher at an average of 7.3% per year, 14.1% since China and India became significant importers in 1998. Note that US Federal debt increased in tandem with oil imports. It is likely gas prices will jump much higher as the dollar loses its monopoly in the world oil-trade. China is to force the Saudis to start trading in the Yuan.
 To change the energy behind their economies:
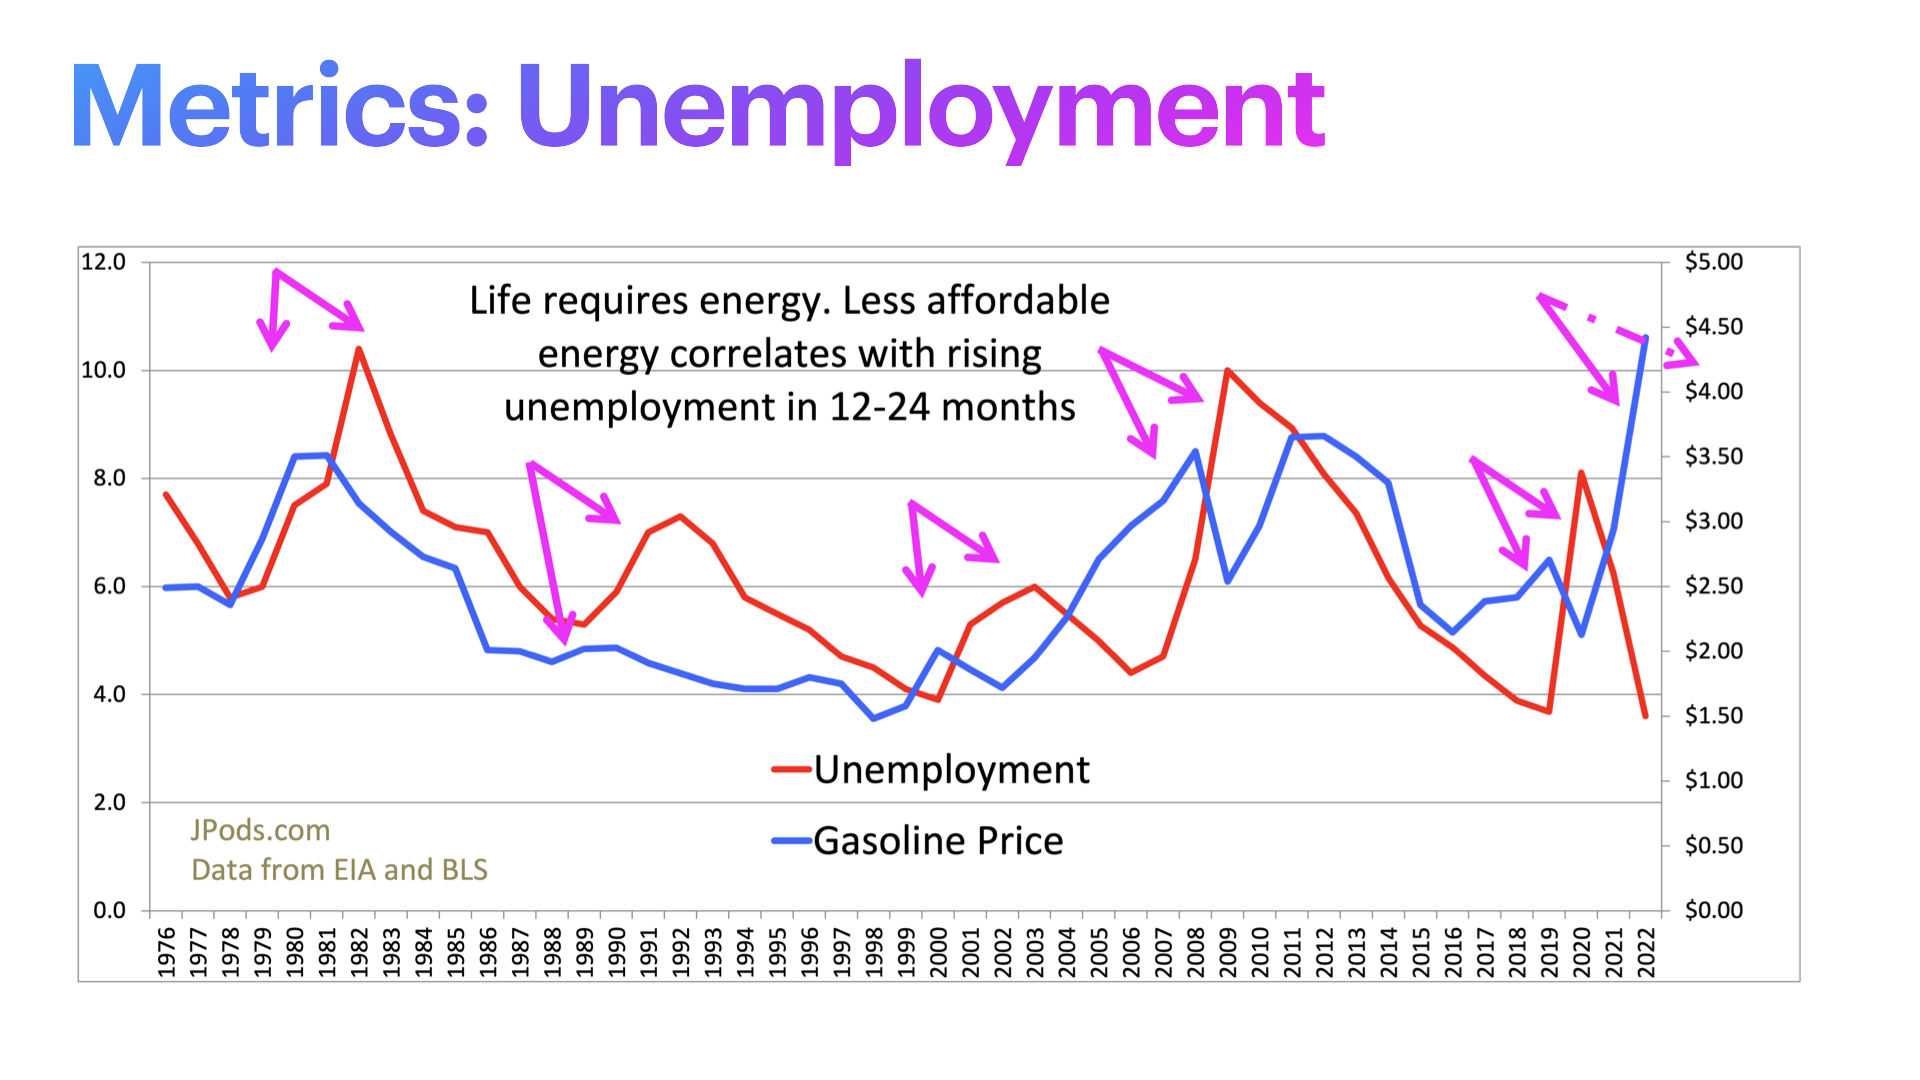
Gas Prices as Unemployment Forecaster
US Oil Production As Metric of Economic Security
“Energy resources are the reserve account behind currency. The economy can grow as long as there is surplus affordable energy in that account.” Art Berman The energy behind the US dollar is depleting at the rate of 1 million barrel per day per year.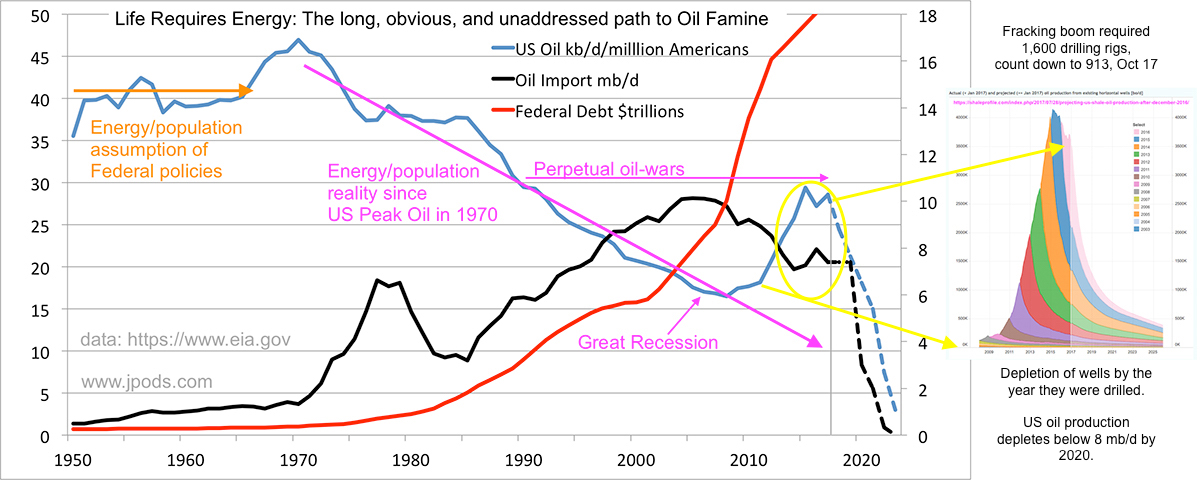 The Law of Supply and Demand has been clear since US Peak Oil in 1970. As US oil fields depleted gas prices ratched higher at an average of 7.3% per year, 14.1% since China and India became significant importers in 1998. Note that US Federal debt increased in tandem with oil imports. It is likely gas prices will jump much higher as the dollar loses its monopoly in the world oil-trade. China is to force the Saudis to start trading in the Yuan.
To change the energy behind their economies:
The Law of Supply and Demand has been clear since US Peak Oil in 1970. As US oil fields depleted gas prices ratched higher at an average of 7.3% per year, 14.1% since China and India became significant importers in 1998. Note that US Federal debt increased in tandem with oil imports. It is likely gas prices will jump much higher as the dollar loses its monopoly in the world oil-trade. China is to force the Saudis to start trading in the Yuan.
To change the energy behind their economies:
- Saudi Arabia announced their $2 trillion “Post-oil Era” fund.
- China announced a $50 trillion solar grid.
- There is a $100 Trillion Shift From ‘Just-In-Time’ To ‘Just-In-Case’ energy.
- Currently the Federal government is protecting their oil-powered monopoly and failing to warn the American people they must adapt to become energy self-reliant, 1 Mb/d Oil Depletion Vs. EIA’s Rosy Forecast
- Recognize Illicit Energy, dependence on energy outside self-reliance. Federal support for Illicit Energy from foreign oil repeats the Path to War of Federal support for Illicit Energy from slavery.
- Face the brutal fact that US Peak Oil was in 1970.
- Leverage transportation as the catalyst for changing energy systems
Transportation, the Catalyst for Changing Energy Systems
Transportation has always been the catalyst for changing energy systems:
-
Paddle a canoe, build a water wheel.
-
Sail a boat, build a windmill.
-
Ride a horse, harness a horse to a plow.
-
Railroads in the 1860s allowed the extraction industries to scale from $100 a barrel for oil to $3.
-
JPods and other solar-powered mobility networks will result in displacing fossil fuels with solar.
![]()
Other
Clever Uber youtube of the foolishness of moving people in two-ton boxes.- The Broken Algorithm That Poisoned American Transportation
- Is the Juice Worth the Squeeze. South Carolina Traffic Costs by Vince Graham
As with the near century of rotary dial telephones under Federal monopoly, the barrier to transportation innovation is the unconstitutional Federal highway monopoly. Here is a 2006 Fox News story on the gargage quality JPods network.
FastCompany article with excellent links to metrics: 12 foolproof ways to get cars out of cities
Fox News Story JPods 2006, Garage Quality from Bill James on Vimeo.
https://www.rita.dot.gov/bts/sites/rita.dot.gov.bts/files/publications/f…
http://www.fhwa.dot.gov/livability/fact_sheets/transandhousing.cfm
https://www.mikeontraffic.com/numbers-every-traffic-engineer-should-know/
What does America spend on transportation and infrastructure? Is transportation infrastructure improving?
Transportation as a Service can be provided if access to the airspace over public Right of Ways is governed by the 5X5 Performance Standard of:
- Exceed efficiency of current approved transport modes by 5 times.
- Pays 5% of gross transportation revenues for non-exclusive use of Rights of Way.